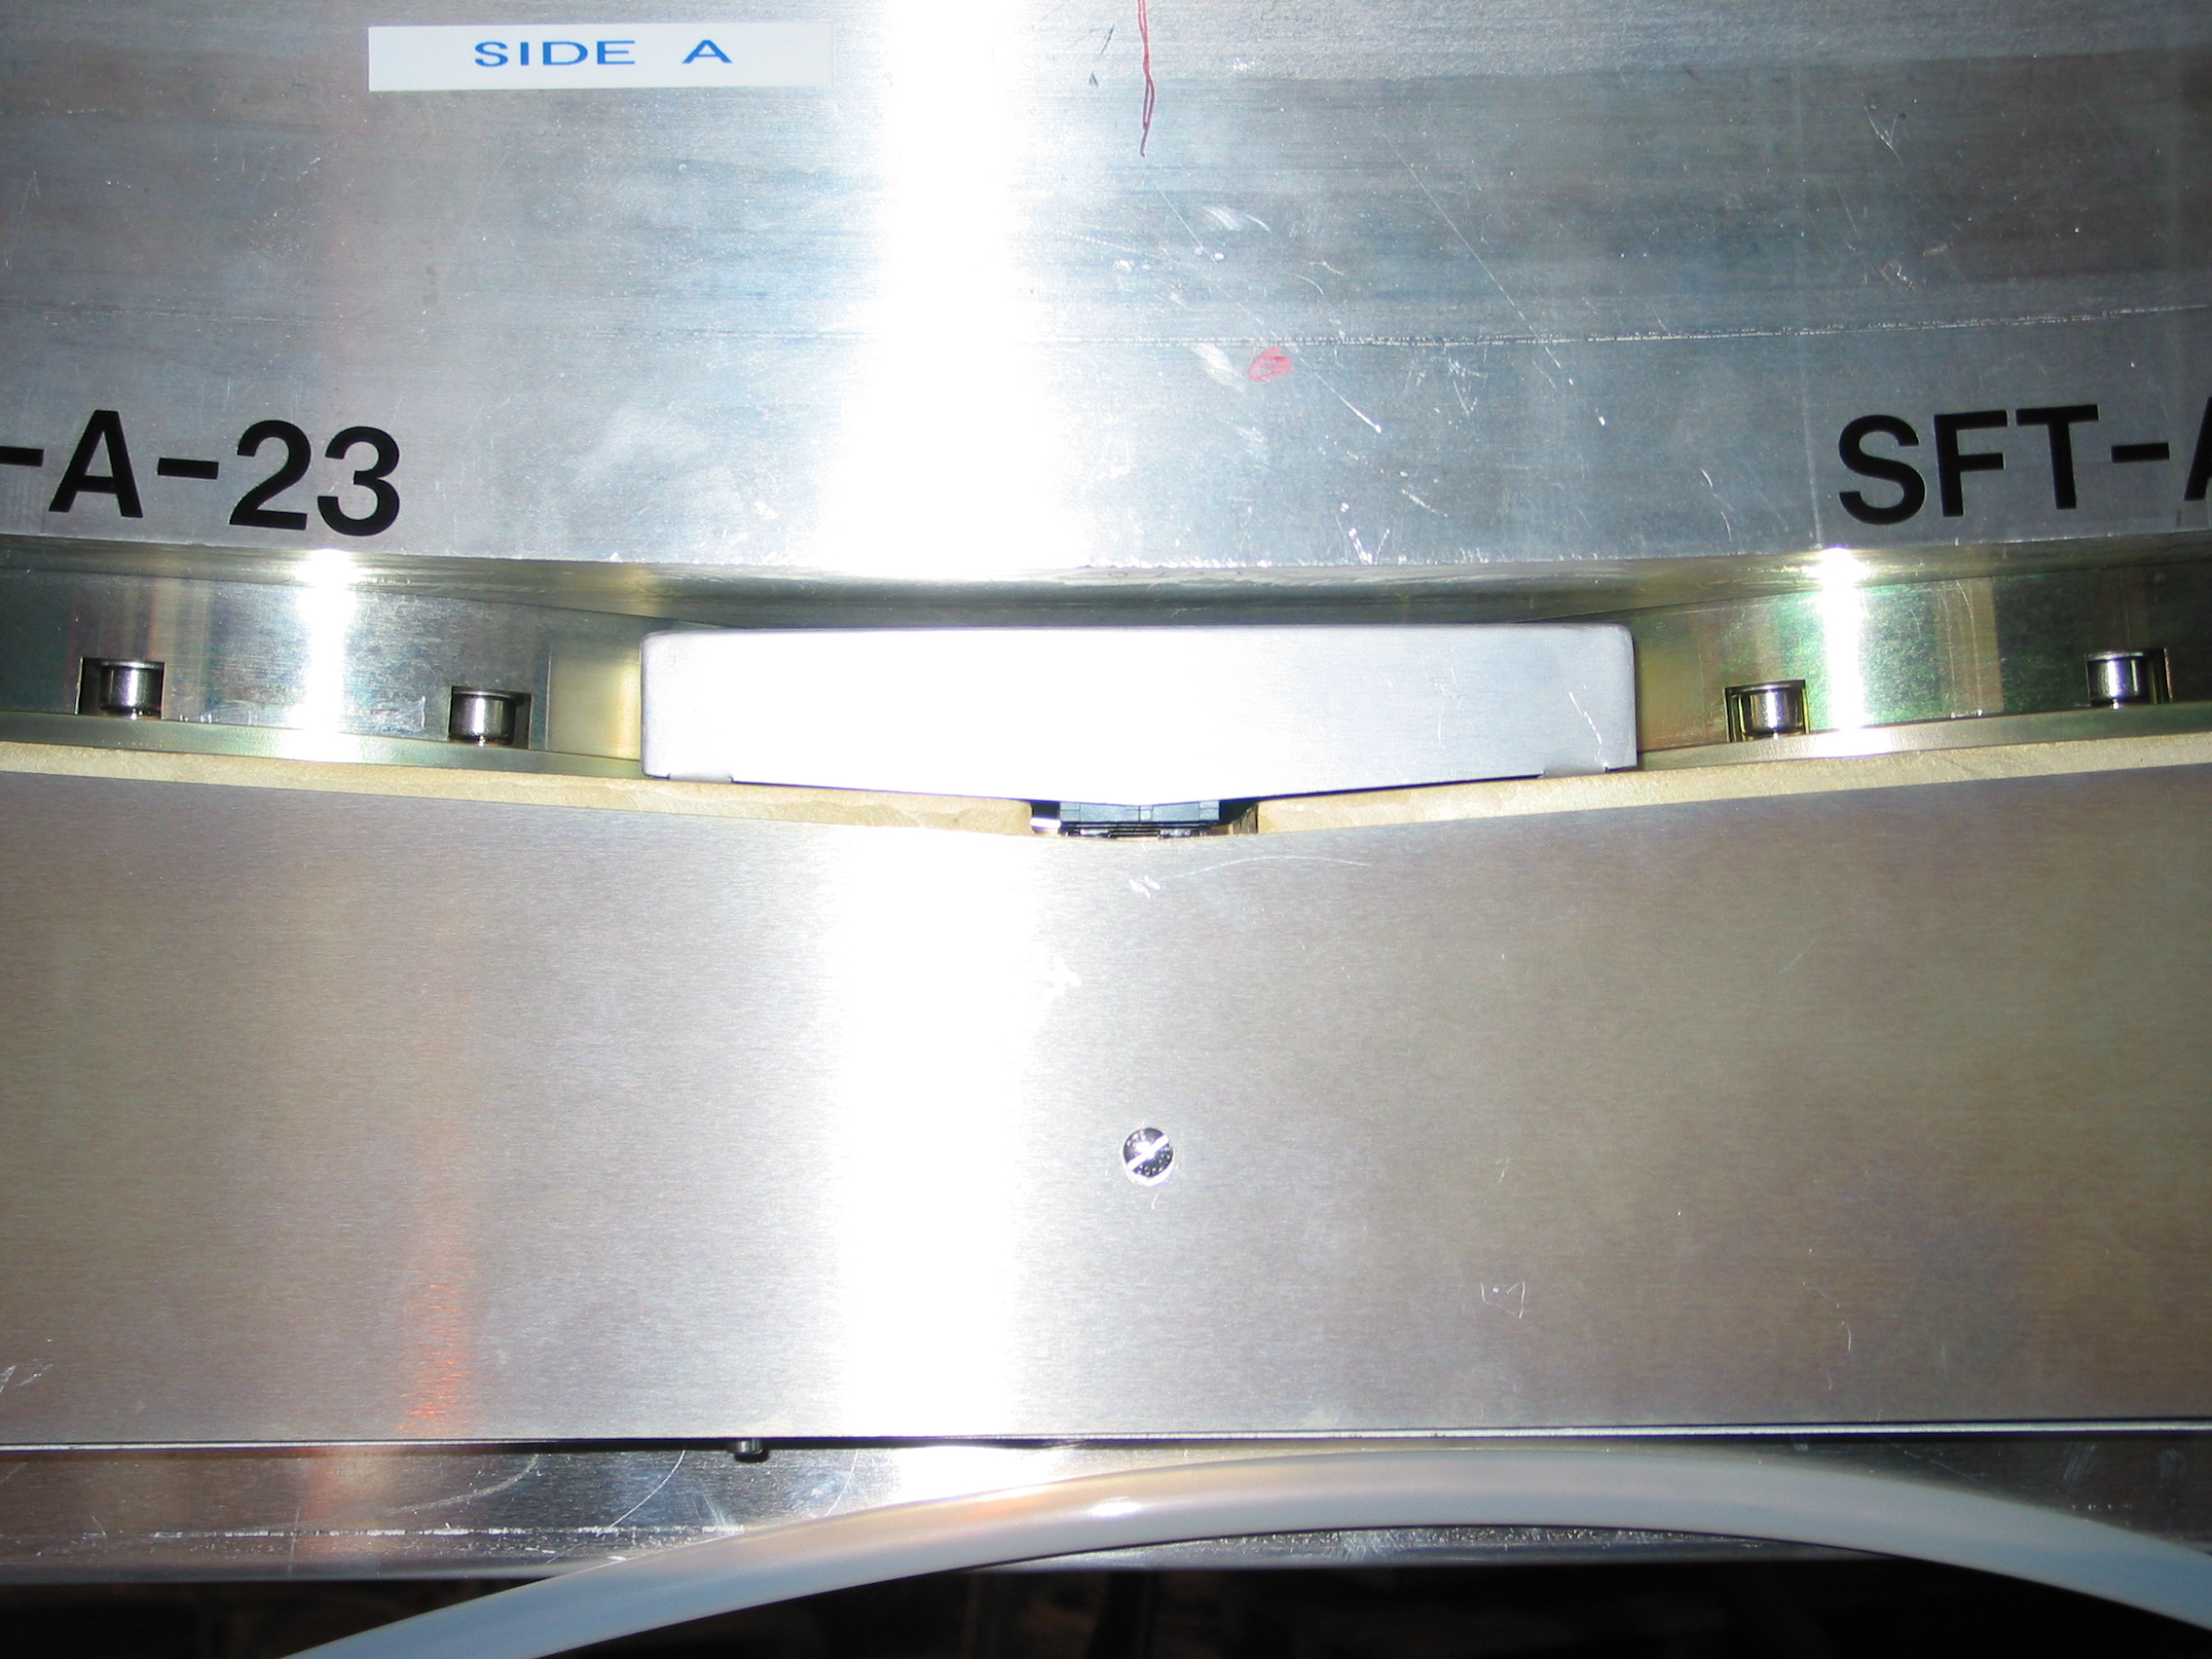
| Figure 1: Hadronic end-cap EST (cell) |
| Figure 1: Hadronic end-cap EST (cell) |
This structure
optimizes the signal-to-noise ratio while reducing the high-voltage
requirements and ionization pile-up, and limiting the effect of failure
modes such as high-voltage sparks and shorts.
The signals are amplified and summed employing the concept of
"active pads": the signals from two consecutive pads are fed into
separate amplifiers (based on GaAs electronics) and summed to read-out
channels. The use of cryogenic GaAs preamplifiers provides the optimum
signal-to-noise ratio for the HEC.
The boards with the GaAs chips are mounted on the outer
radius of the HEC. The use of cryogenic GaAs preamplifiers provides
the optimum signal-to-noise ratio for the HEC.
| Figure 2: Hadronic end-cap module |
One wheel has roughly 4 x 7 m size. On the fig. 3 you can see the first from four HEC wheels
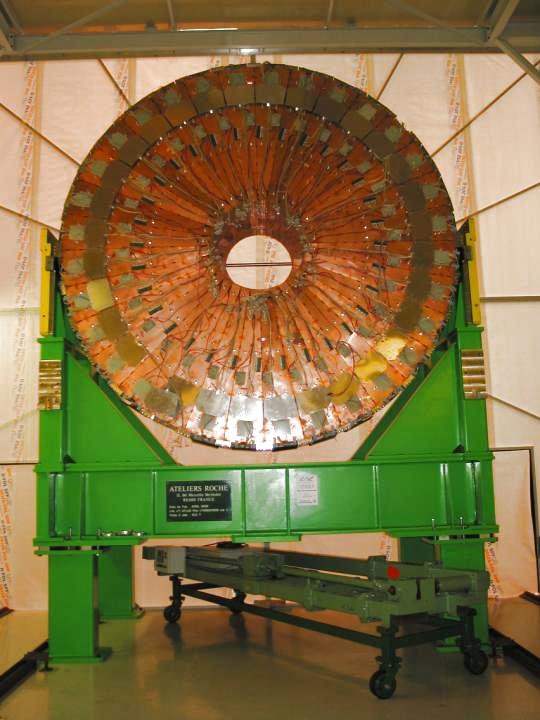
| Figure3: One wheel of HEC |
Pad structure defines lateral segmentation
in (eta, phi) = 0.1 x 0.1. LAr gap is instrumented with 1 PAD board and
2 EST boards. From the electronic point of view HEC has 92 160 full
independent read-out channels, which is approximately two-time more
than in the up today largest liquid argon calorimeter which is used
in H1 in
DESY,
Hamburg.
Our project from the view on the development and realization of the
calibration procedures for HEC is possible to divide into three
parts, which in the present time status quo is following:

| Figure 4: The calibration signal (left) and the prediction for the ionization signal (right) together with the residuals with the respects to the fit (lower figures) |
We participate also on the design and laboratory tests of the Front
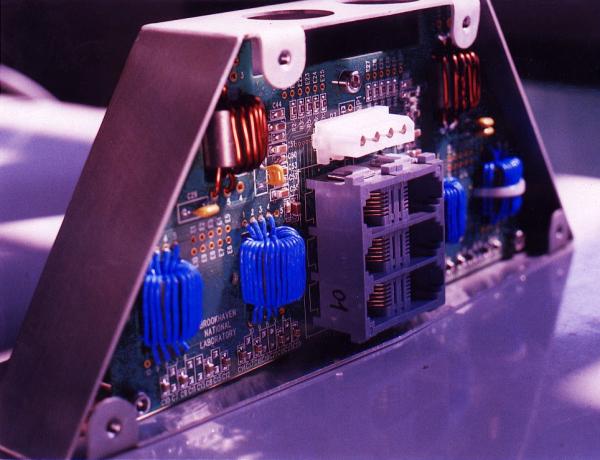
End Board (FEB) for Atlas experiment. The FEB, see fig. 5,
| Figure 5: The view on the FEB |
is going to be used for the EM and HEC part of the Atlas calorimeter. As described in the TDR of the liquid argon (LAr) calorimeter, the FEBs contain the electronics for amplifying, shaping, sampling, pipeling, and digitizing the LAr calorimeter signals. The FEB electronics e..g. must handle the signal dynamic range of about 16 bits without contributing more than 0.2%.
| Figure 6: Dividing ratio of the Front Module Calibration Distribution Boards of HEC |
| Figure 7: Filter box |
all needed quality criteria.
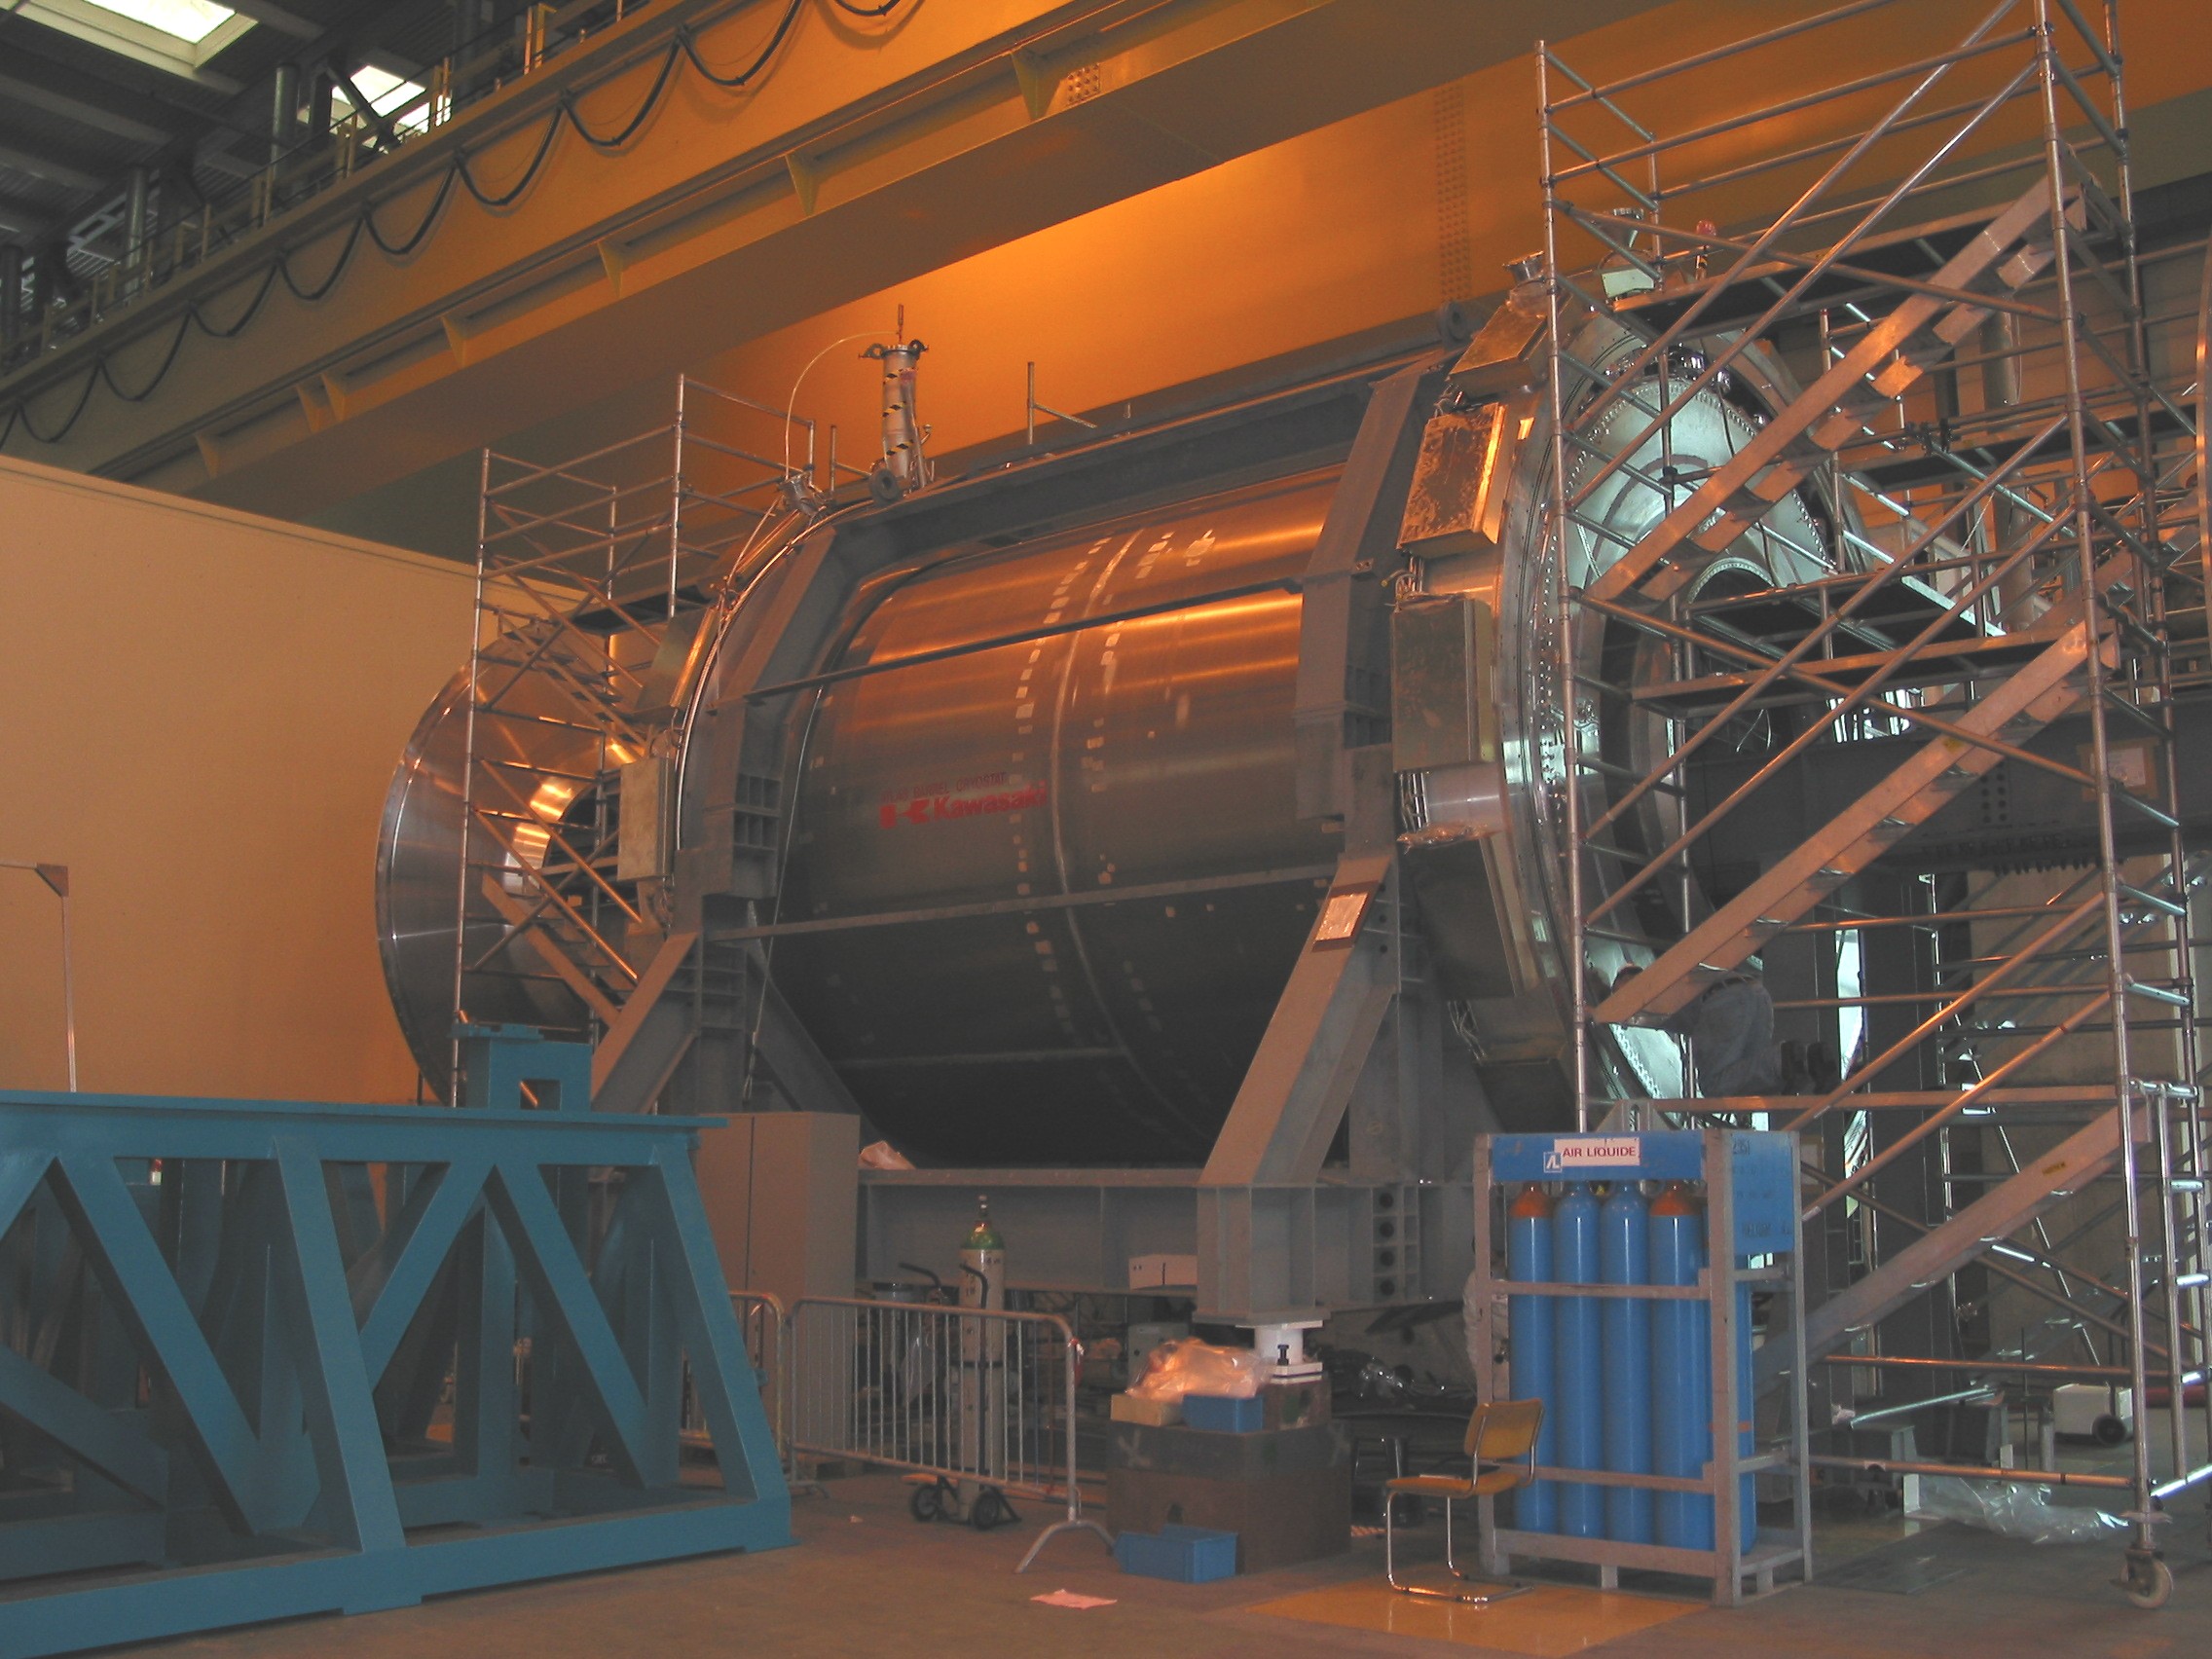
| Figure 8: ATLAS barrel cryostat |
the ATLAS barrel cryostat with our filter boxes (see
fig. 9 in more detail) is shown.
| Figure 9: Detail view: the filter box in the ATLAS barrel cryostat |

| Figure 10:
The noise reduction for 100 GeV electron
deposits in HEC module 0 a) before and b) after filter applying |
| Figure 12:
The energy resolution of electrons in EMBarrel
|